
Power BI vs Tableau — if you’re starting a career in data analytics in 2026, this is one of the most common and important questions you’ll face.
Both tools are industry leaders in data visualization and business intelligence. Companies across industries rely on them to analyze data and make informed decisions.
But which one should you learn first?
In this guide, we’ll compare Power BI and Tableau in detail, covering features, pricing, learning curve, and career opportunities.
What is Power BI?
Power BI is a business analytics tool developed by Microsoft.
It allows users to:
- Create interactive dashboards
- Generate business reports
- Analyze large datasets
Power BI integrates seamlessly with tools like Excel and other Microsoft products, making it extremely popular among businesses.
👉 It is widely considered the best tool for beginners.
What is Tableau?
Tableau is a powerful data visualization platform known for its advanced analytics capabilities.
It is used for:
- Creating highly interactive dashboards
- Advanced data visualization
- Handling large datasets
Tableau is widely adopted by data professionals and organizations that require deeper analytical capabilities.
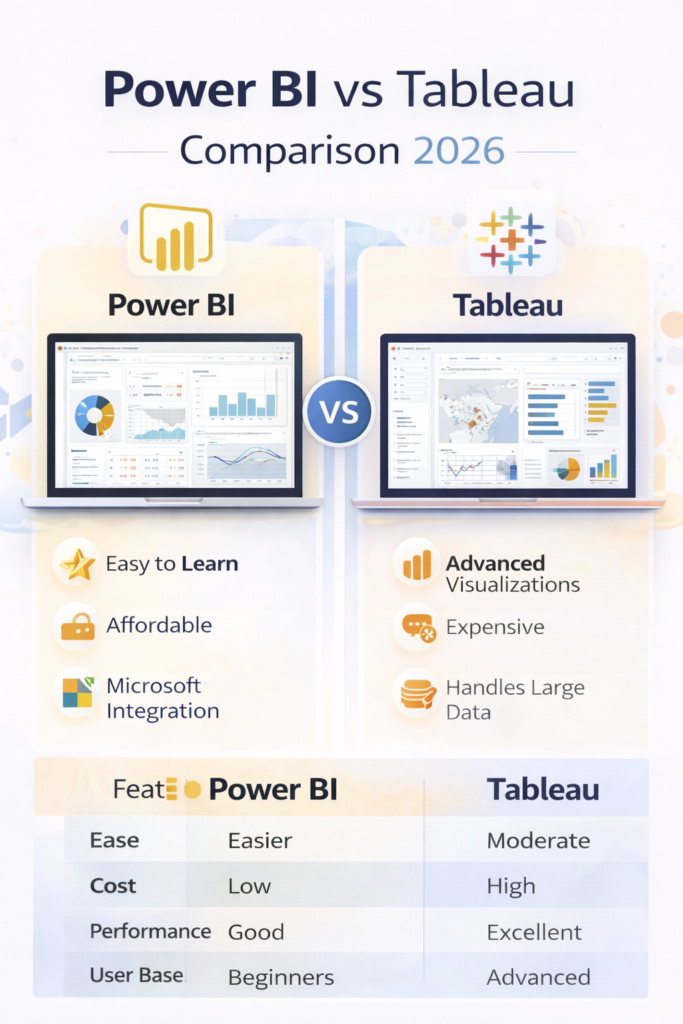
Key Differences Between Power BI and Tableau
| Feature | Power BI | Tableau |
|---|---|---|
| Developer | Microsoft | Tableau |
| Ease of Use | Easy | Moderate |
| Cost | Affordable | Expensive |
| Performance | Good | Excellent |
| Visualization | Good | Advanced |
👉 While both tools are powerful, their use cases differ slightly.
Ease of Learning
One of the biggest deciding factors is how easy the tool is to learn.
- Power BI: Beginner-friendly with a simple interface
- Tableau: Requires more time to master
👉 If you are just starting, Power BI is usually the better choice.
Cost Comparison
Cost plays an important role, especially for beginners.
- Power BI:
- Free version available
- Paid plans are affordable
- Tableau:
- More expensive
- Limited free features
👉 Power BI is clearly more budget-friendly.
Features Comparison
Power BI Features
- Strong integration with Microsoft ecosystem
- Easy-to-use dashboards
- Real-time data analysis
- Suitable for business reporting
Tableau Features
- Advanced visualizations
- Better performance with large datasets
- Highly customizable dashboards
- Strong analytics capabilities
👉 Tableau is often preferred for complex data analysis.
Performance and Scalability
When working with large datasets:
- Power BI performs well for small to medium datasets
- Tableau handles large datasets more efficiently
👉 For enterprise-level analytics, Tableau has an edge.
Career Opportunities
Both tools are in high demand and are used for roles such as:
- Data Analyst
- Business Analyst
- BI Developer
👉 However:
- Power BI → More beginner job opportunities
- Tableau → Preferred for advanced roles
Which One Should You Choose?
Choose Power BI if:
- You are a beginner
- You want a cost-effective tool
- You are familiar with Microsoft tools
Choose Tableau if:
- You want advanced visualization skills
- You are targeting high-paying roles
- You work with large datasets
🔍 People Also Ask: Power BI vs Tableau
Which is better: Power BI or Tableau?
Power BI is better for beginners and affordability, while Tableau is better for advanced analytics and visualization.
Is Power BI enough to get a job?
Yes, Power BI is widely used and can help you secure entry-level data analyst roles when combined with SQL and Excel. Learn about SQL certifications .
Should I learn Tableau after Power BI?
Yes, many professionals start with Power BI and later learn Tableau to enhance their skillset.
Which tool is more in demand in 2026?
Both tools are in demand, but Power BI is more widely used among beginners and small to mid-sized companies.
Final Verdict
The Power BI vs Tableau debate ultimately depends on your goals.
👉 If you are just starting your data analytics journey:
Go with Power BI
👉 If you want to advance your career and work on complex data projects:
Learn Tableau
👉 Best strategy:
Start with Power BI → Move to Tableau later
Read the Data Analytics Roadmap article to start your Data Analyst Journey.
Power BI vs Tableau FAQs
Q1: Which is better: Power BI or Tableau?
Power BI is better for beginners and affordability, while Tableau is better for advanced data visualization and analytics. The right choice depends on your experience level and career goals.
Q2: Is Power BI easier to learn than Tableau?
Yes, Power BI is generally easier to learn than Tableau. It has a user-friendly interface and integrates well with Microsoft tools, making it ideal for beginners.
Q3: Should I learn Power BI or Tableau first?
Beginners should start with Power BI due to its simplicity and lower cost. Once comfortable, you can learn Tableau for advanced visualization skills.
Q4: Is Tableau better than Power BI for jobs?
Both tools are valuable for jobs. Power BI is widely used for entry-level roles, while Tableau is often preferred for advanced analytics and higher-level positions.
Q5: Do I need both Power BI and Tableau?
No, you don’t need both tools initially. Learning one tool is enough to start your career. However, knowing both can give you an advantage in the job market.
Q6: Is Power BI enough to become a data analyst?
Power BI is an important skill, but it is not enough alone. You should also learn SQL, Excel, and basic data analysis concepts to become a data analyst.
Q7: Which tool is more in demand in 2026: Power BI or Tableau?
Both tools are in demand, but Power BI is more widely used due to its affordability and integration with Microsoft products.